Power BI
Visualization of big data
Use the potential of Power BI to analyse and link large amounts of data from different sources and visualize them in an appealing way. Recognize trends in advance to make better decisions in your business strategy.
Mobile reporting with Power BI: all data at a glance
Services from awisto
Our Power BI experts create impressive reports and KPI dashboards from your company data, which serve as a clear and expressive aid for reporting, especially for managing directors and decision-makers.
- Professional support with data integration, modelling and visualization for meaningful reports and dashboards
- Practical training for effective use so that you can quickly create your own reports
- Accompanying support for questions or problems
Contact us today for a consultation. We look forward to hearing from you.
Our Power BI Showcase
Discover the impressive possibilities offered by the Microsoft BI platform with our showcase. Here you can discover the extensive functionalities at your leisure. If you have any questions, we will be happy to help you.
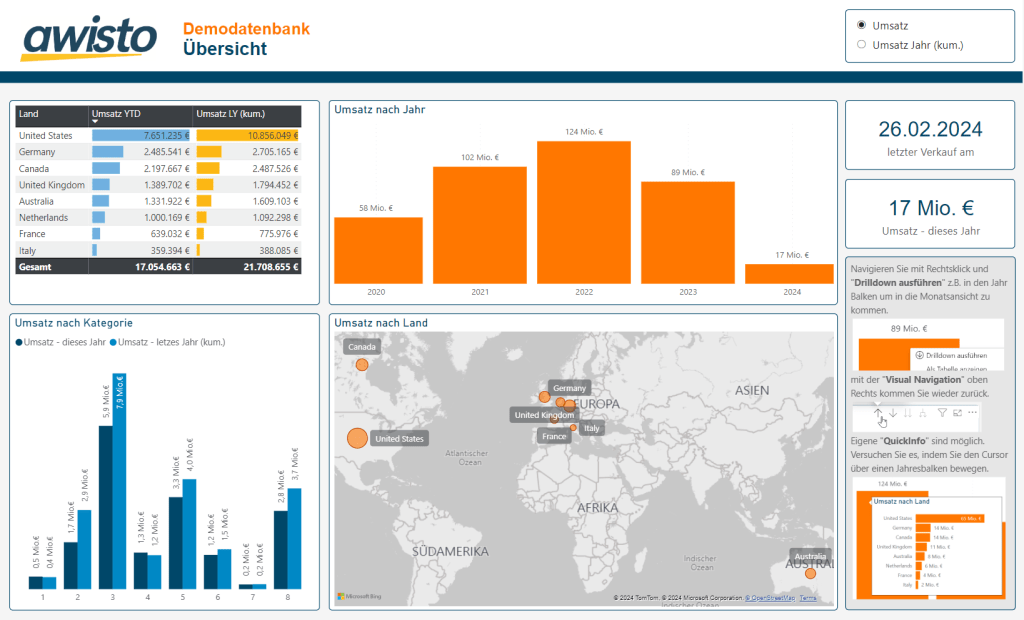
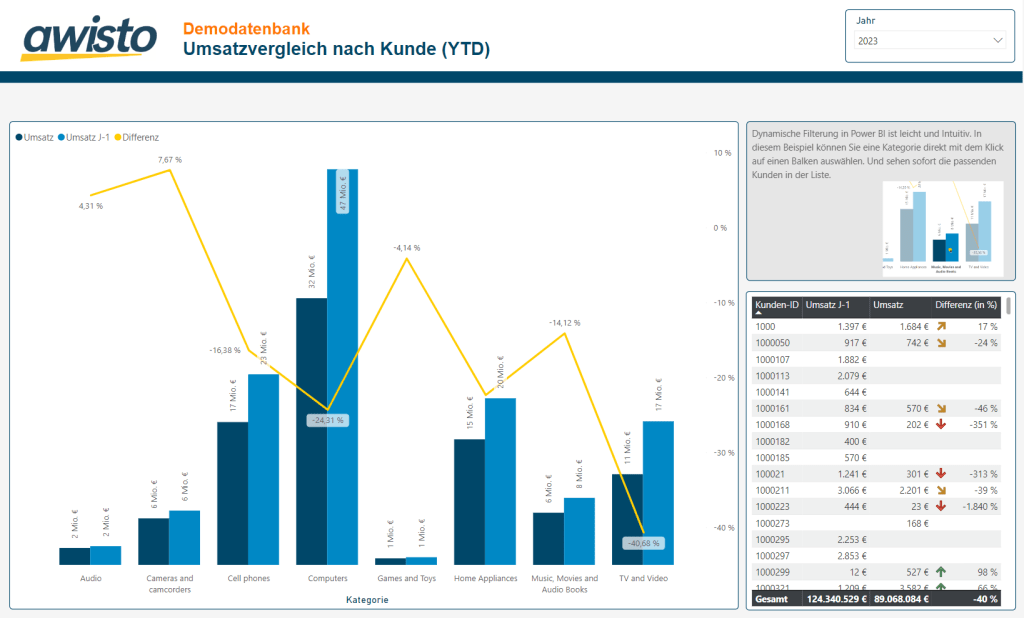
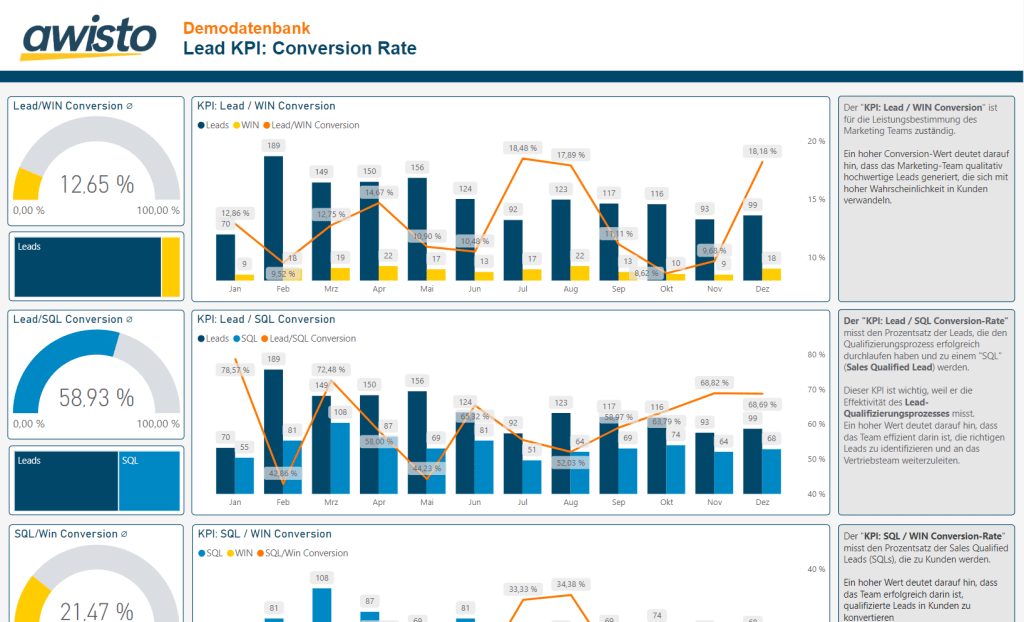
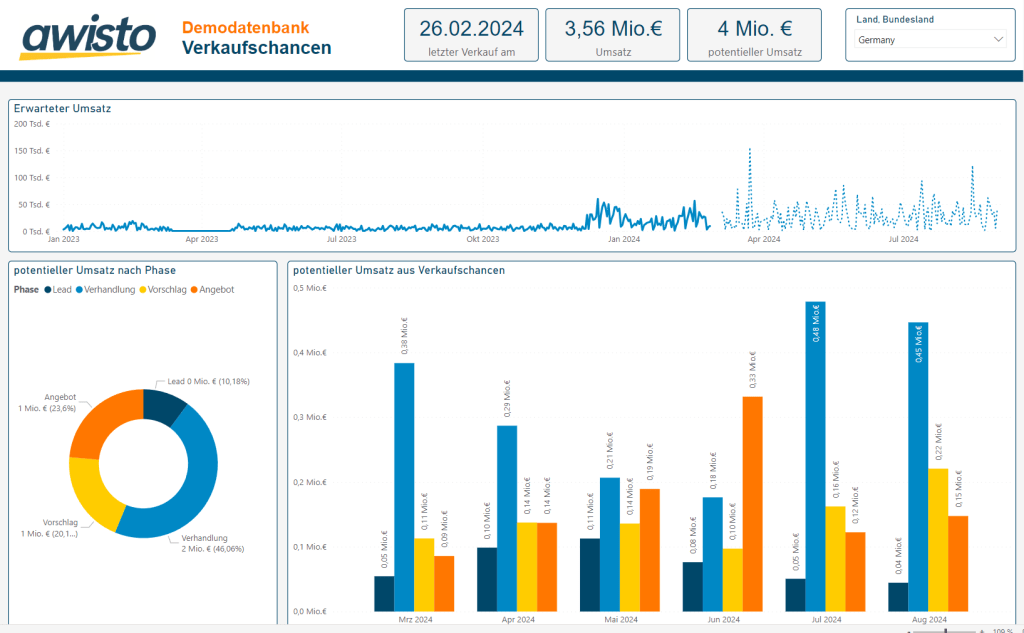
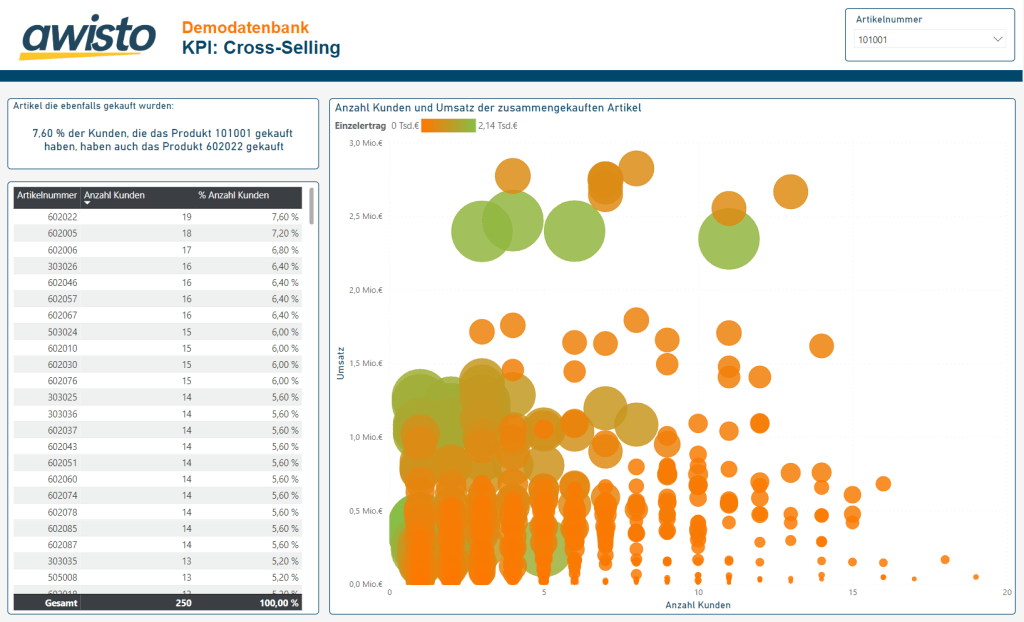
This report presents an exemplary visualization of sales data using Microsoft sample data.
- Impressive data experiences thanks to interactive visuals
- Discover reusable KPIs from raw data
- Clear tooltips with user-defined visuals
- Values visible on an interactive map
- Any drill-down and drill-up functions such as:
- Country / State / City
- Product category / product
- Automatic clustering of data
- Cumulative values with comparisons to other time periods

Power BI Licences| Your requirements – our consulting
Convinced that the solution is right for you?
Then take advantage of your free consultation appointment now. Let us answer your questions about licenses personally. Because Microsoft licensing is constantly changing and is difficult to understand. Call us right away. We look forward to hearing from you.
Contact us

“I would be happy to advise you on the possible uses of Power BI.”
Halim Elmaci
Business Analyst
+49 (711) 490534-0
halim.elmaci@awisto.de


